Home » Knowledge Base » Agent Overview Report: View Open, Won, Lost Cards, and Quotes by Agent
Pipeline Dashboard
Agent Overview Report: View Open, Won, Lost Cards, and Quotes by Agent
July 6, 2026
Release Date: July 3, 2026
This enhancement is available to Admins
Overview
We have introduced a new enhancement to the Agent Overview report under the Dashboard module. This enhancement allows users to filter Agent Overview data by Pipeline and Date within the Pipeline Dashboard, providing a consolidated view of key performance metrics such as Open, Won, Lost, and Close Rate. Users can also access and download detailed reports directly from the metric counts for deeper analysis.
Use Case: Admins can use the Agent Overview report to monitor and analyze agent-wise pipeline performance across selected pipelines and date ranges. The report provides a quick summary of key metrics such as Open, Won, Lost, and Close Rate for each agent, while the detailed reports allow admins to review individual deal records, track sales outcomes, and evaluate overall pipeline performance more effectively.
To view the enhancement:
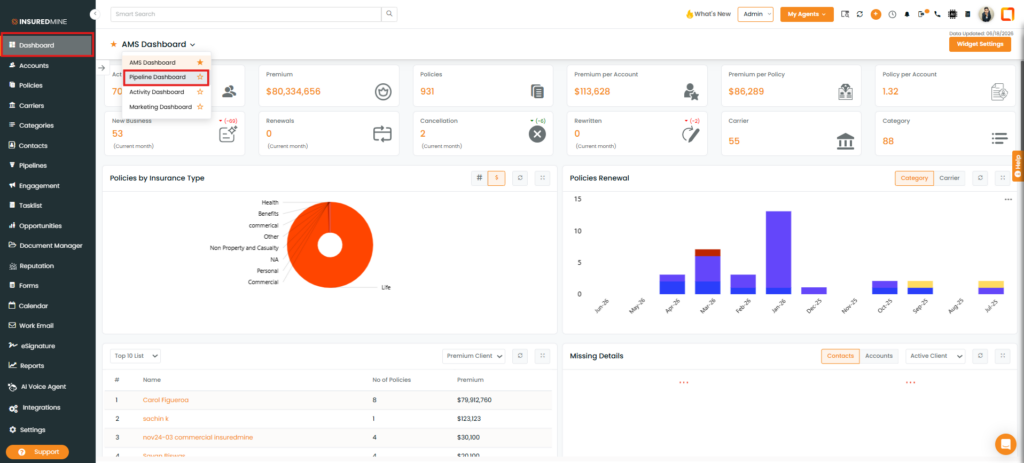
Navigate to Dashboard.
From the Dashboard dropdown, select Pipeline Dashboard.
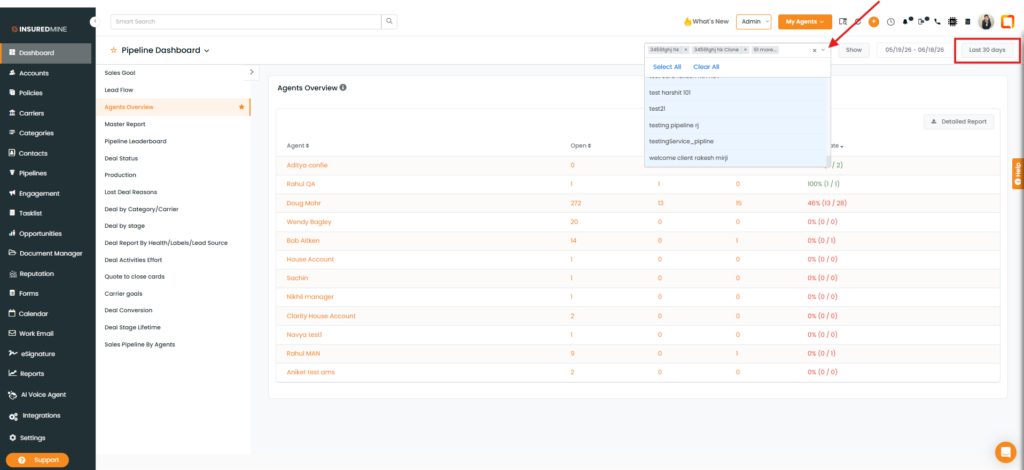
From the Pipeline Dashboard, select Agent Overview.
From the Pipeline dropdown, select the desired pipeline type.
You can also select All to view data across all pipelines.
From the Date dropdown, select the preferred date range.
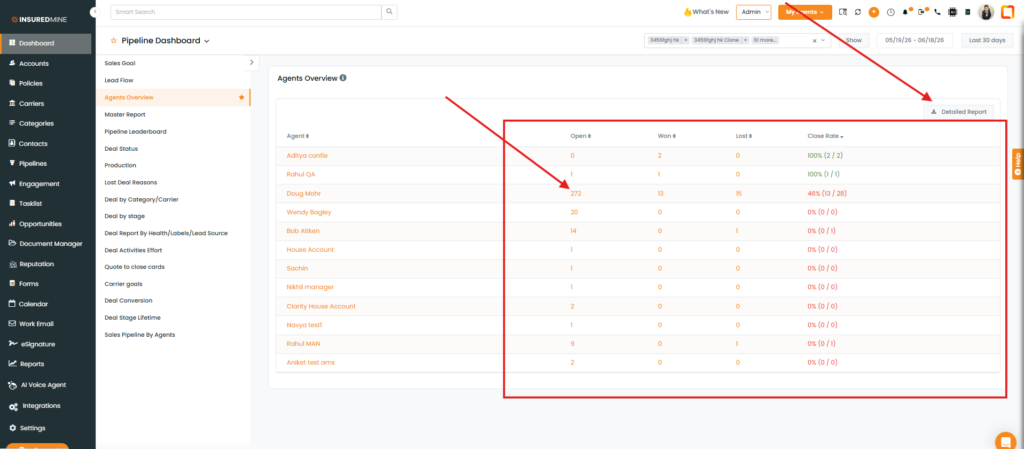
The results will be displayed based on the selected pipeline and date range, including the following metrics:
Open
Won
Lost
Close Rate
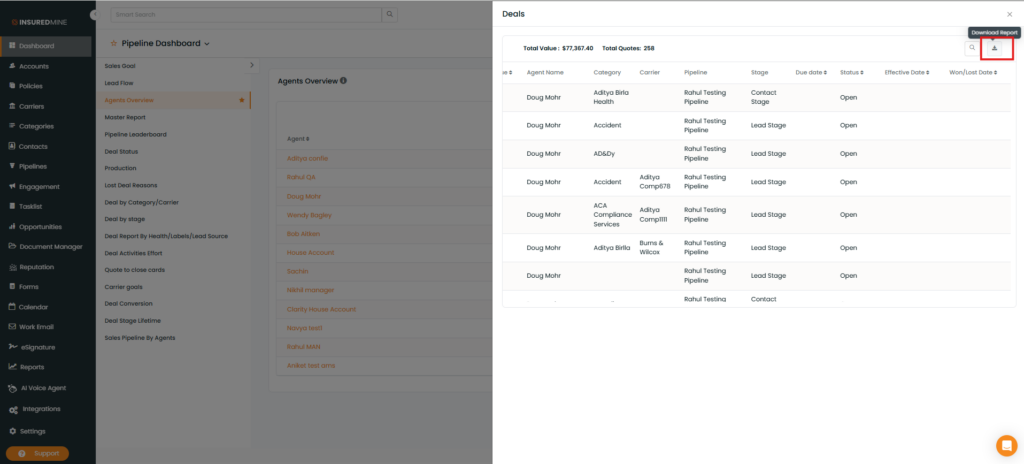
You also have the option to download the detailed report.
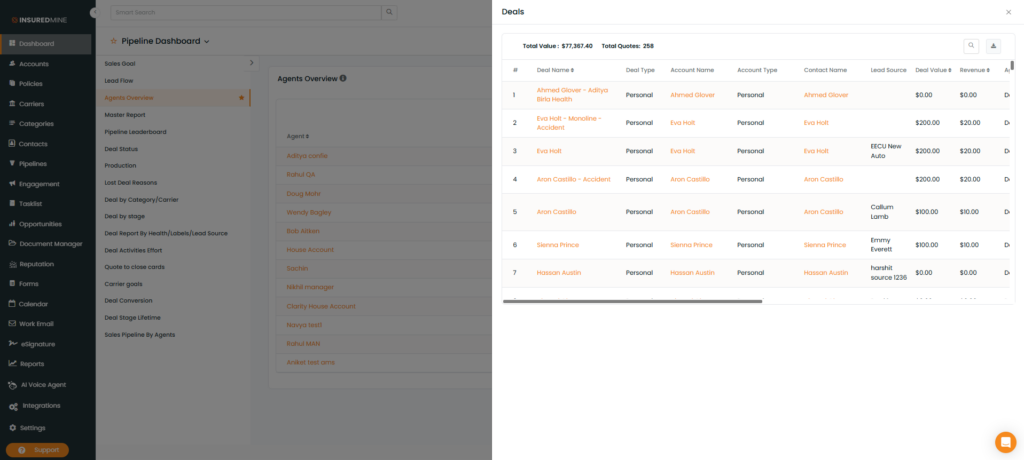
You can also view and download the detailed report by clicking the number displayed under the Open cards count.