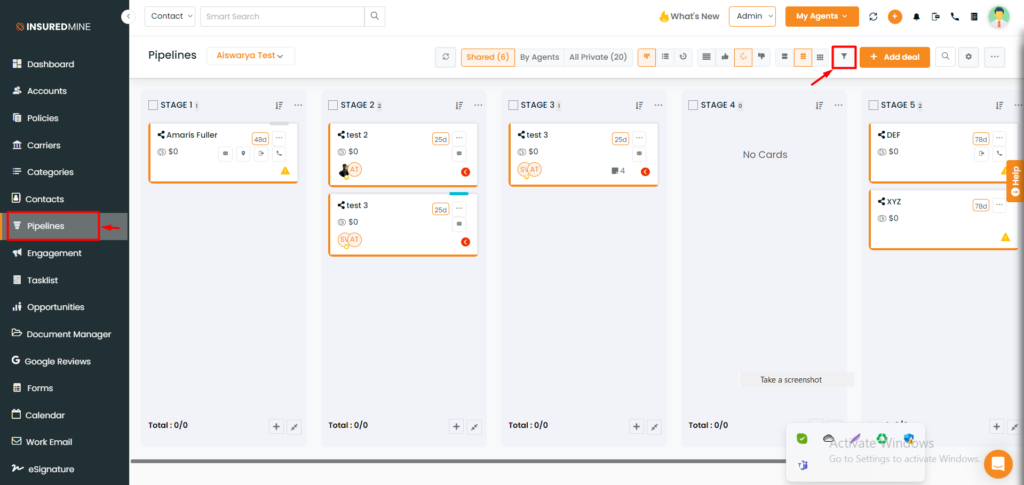
Filter option is available on the top right-hand side of the deal board to filter deals on the basis of Status, Assignee, Label, Category, Deal Health, Due Date, Created Date, and Task Due Date
How to set filters?
Navigate to Pipelines:
Click on the filter icon.
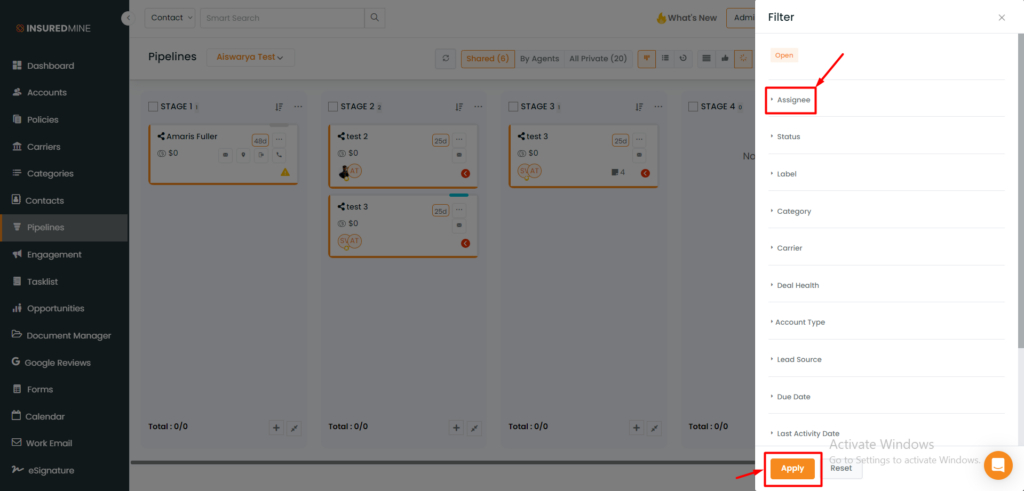
A panel from the right will open with all the filter options.
Click on the desired filter option and set filters accordingly.
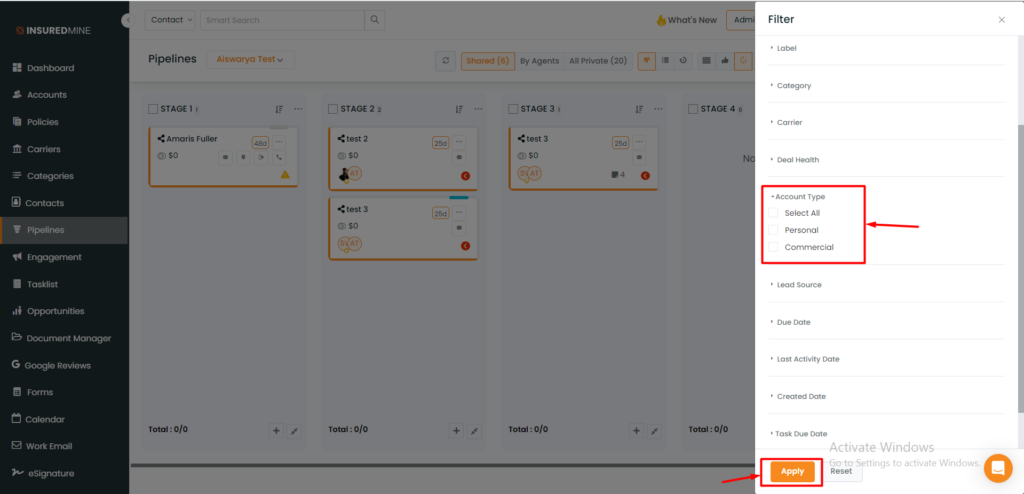
Account Type Filter in Pipeline
In Pipeline Manager, you now can filter the deal cards based on Account Type: Personal or Commercial.
To view the enhancement:
Navigate to Pipelines
Click on Filter.
Select Account Type.
You can choose to select all for both Personal or Commercial or choose each individually.
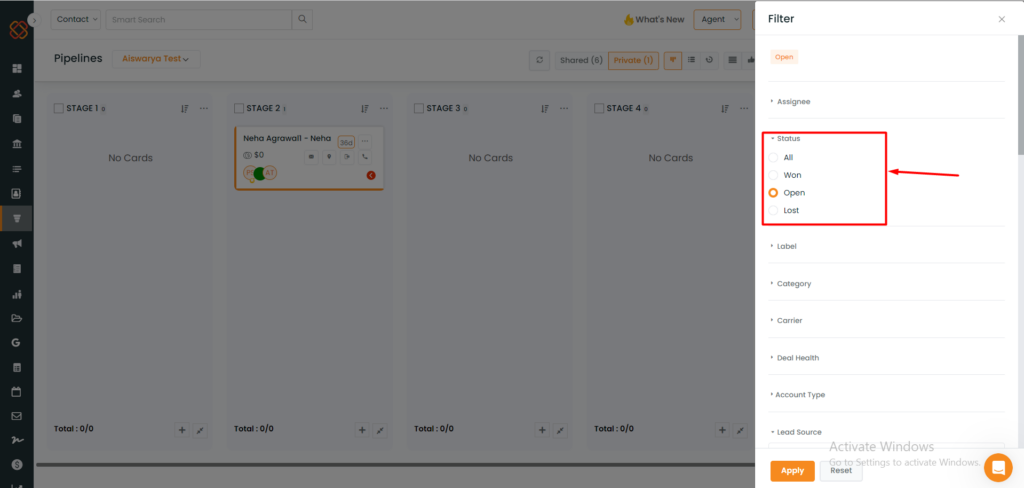
Status Filter in Pipeline:
Status Filter – All, Won, Lost, In Process filters are available. Click on the desired filter to see the deal cards with that particular deal status mentioned in them.
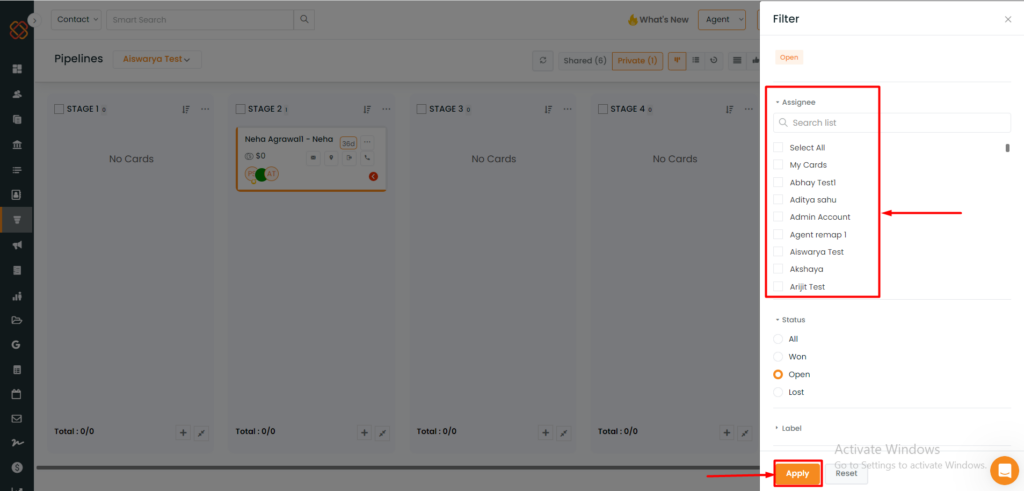
Assignee Filter
With the “Assignee” filter, you can search your assignee list by typing in the search section. Or you can also select the assignee name by clicking on the checkbox beside the assignee name. Based on your selection the deal cards will be visible with those having the selected assignee names in it.
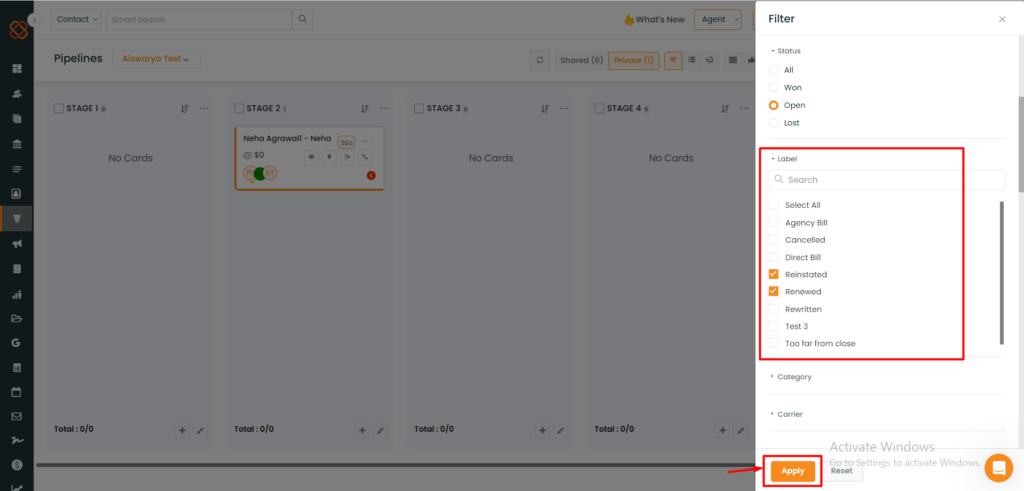
Label Filter
Select the labels of your choice or you can also search and select the labels by typing the name in the search section. Based on your selection, the deal cards will be displayed.
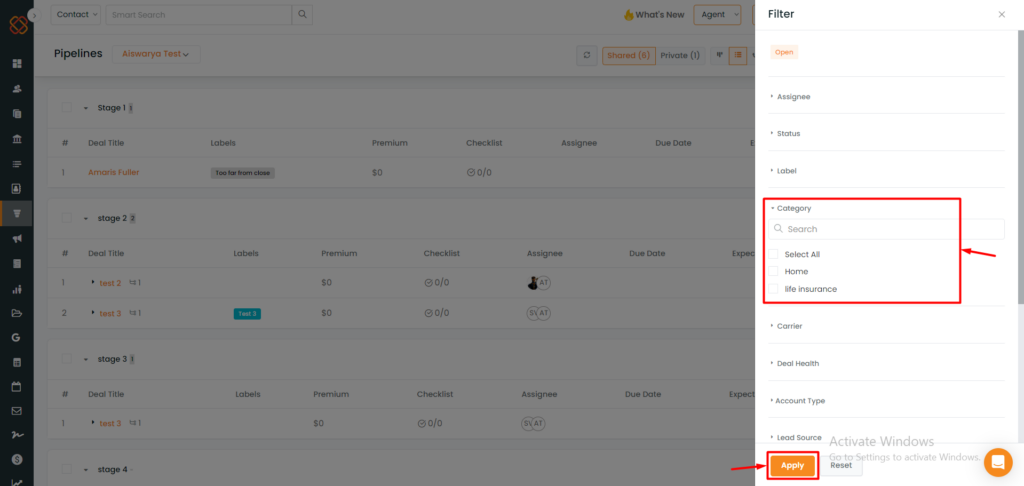
Category filter
In the category section, you can search and select the categories as per requirement or even can select all. Based on your selection, the deal cards will be displayed in the Pipeline.
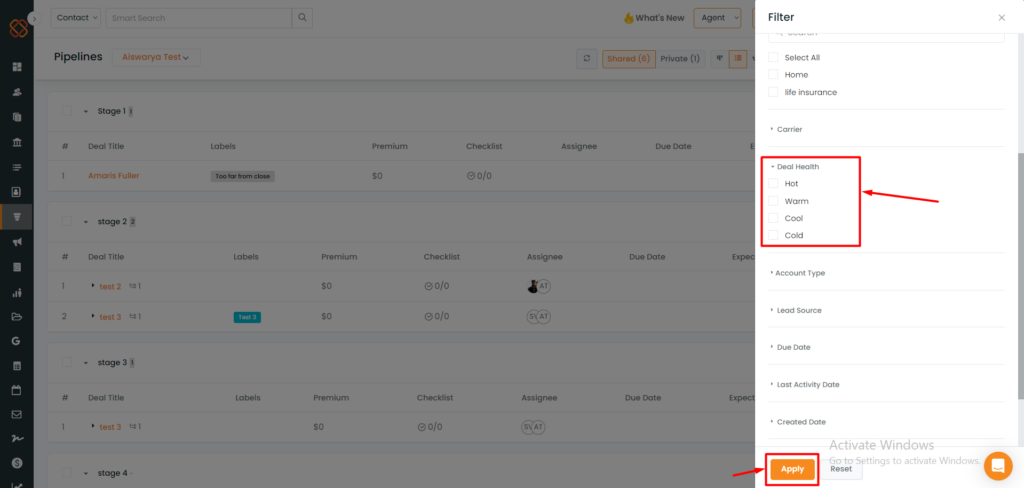
Deal Health Filter-
Select the deal cards based on deal health – Hot, Warm or Cold.
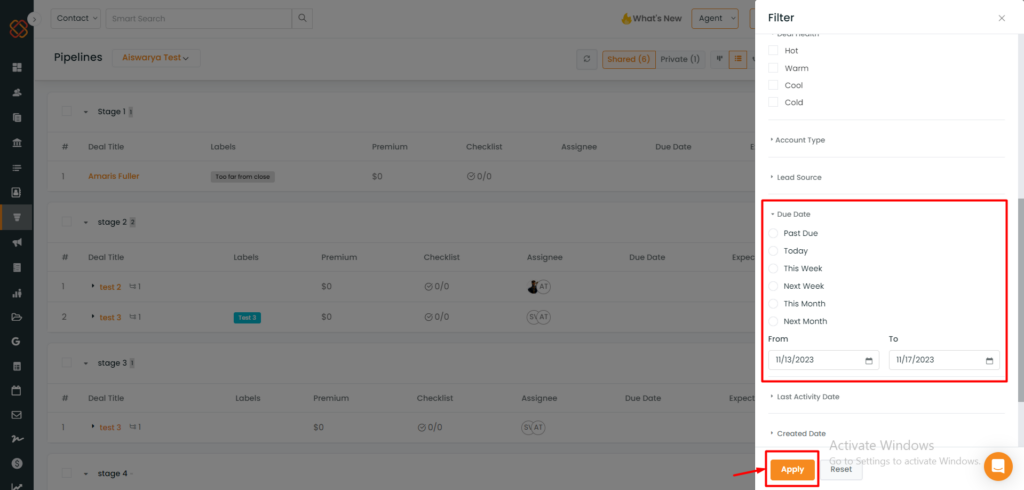
Due Date Filter
This allows you to set the due dates of your choice, or can select from the options provided. Based on the selection, the deal cards will get displayed that have the due dates within the selected span of time.
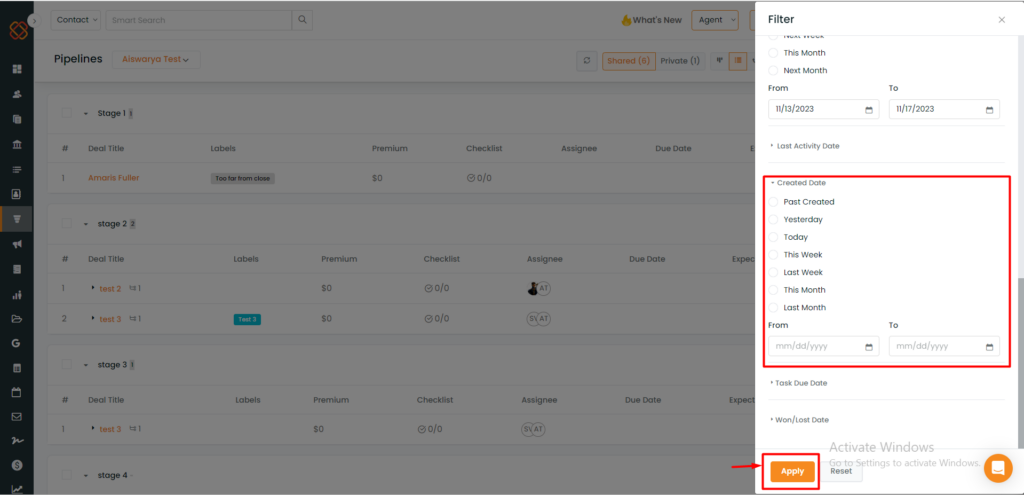
Created Date Filter
You can check the deal card that has been created within the selected span of time.
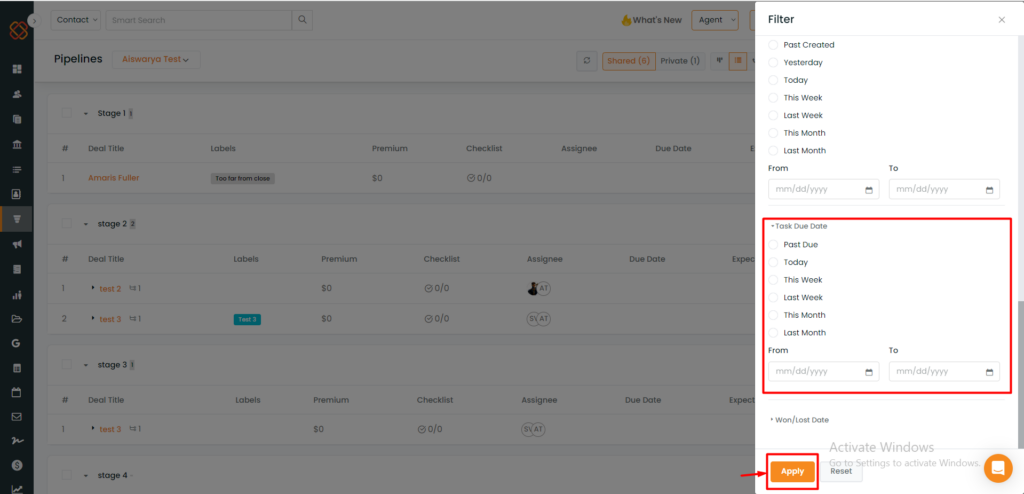
Task Due Date Filter
You can set the task due dates of your choice, or can select from the options provided. Based on the selection, the deal cards will get displayed that have the task due dates within the selected span of time.
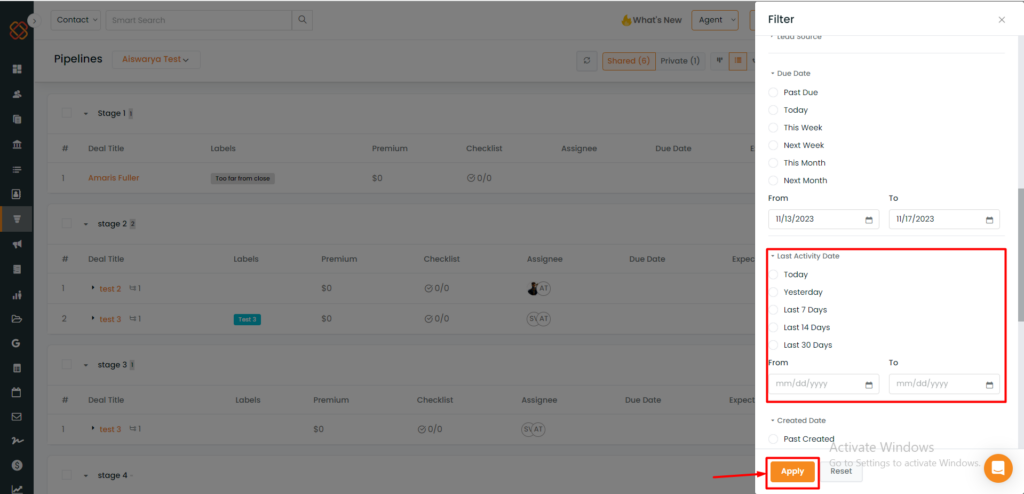
Last Activity Date Filter
You can now filter the deal cards based on the latest activity performed on the deal cards or the latest updated deal cards.
To view the enhancement:
Navigate to Pipelines
Click on the filter icon.
Scroll down and click on Last Activity Date Filter.
You will get the following options- Today, yesterday, last 7 days, Last 14 days, Last 30 days, and custom date range.
Once you select the date range click on apply.
You will get to see the deal cards that are updated in the selected date range.
Types of Charts
Reports
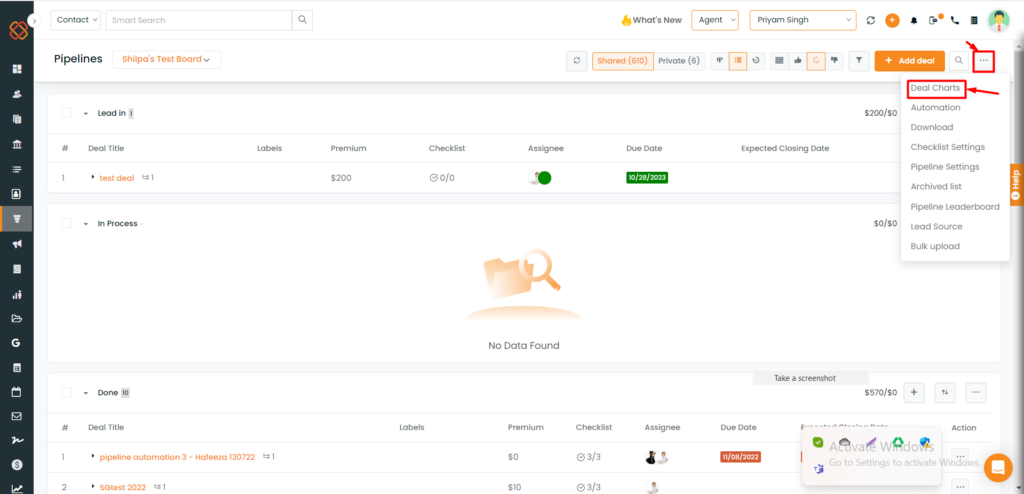
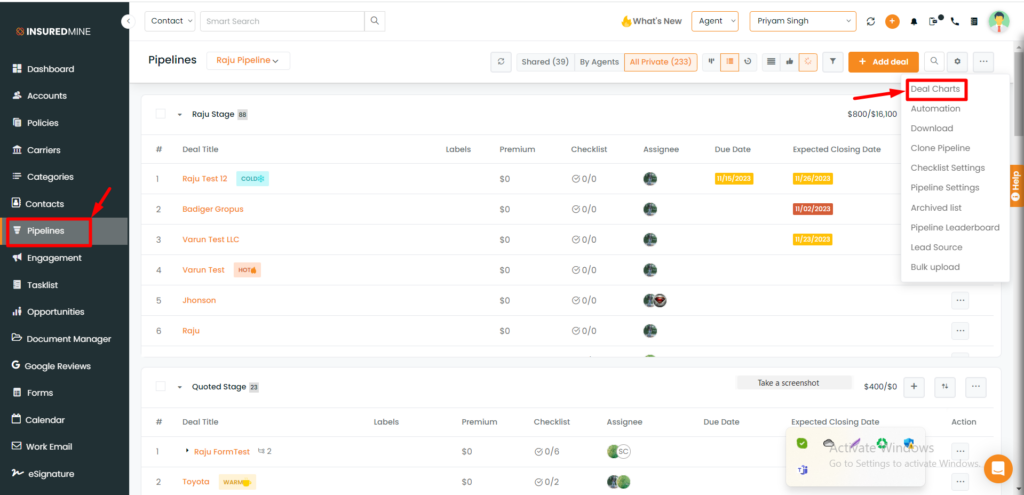
Specific charts and reports are provided to have a better understanding of deal activities, conversations and to learn, what does it take to win deals (i.e. What does winning look like?).To access all these reports and charts click on the three-dots icon and then select “Deal Charts”.
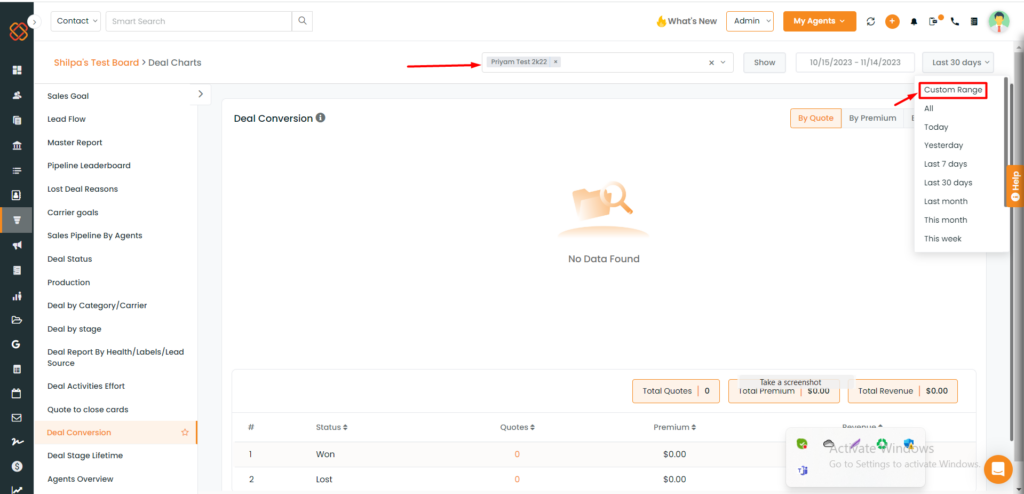
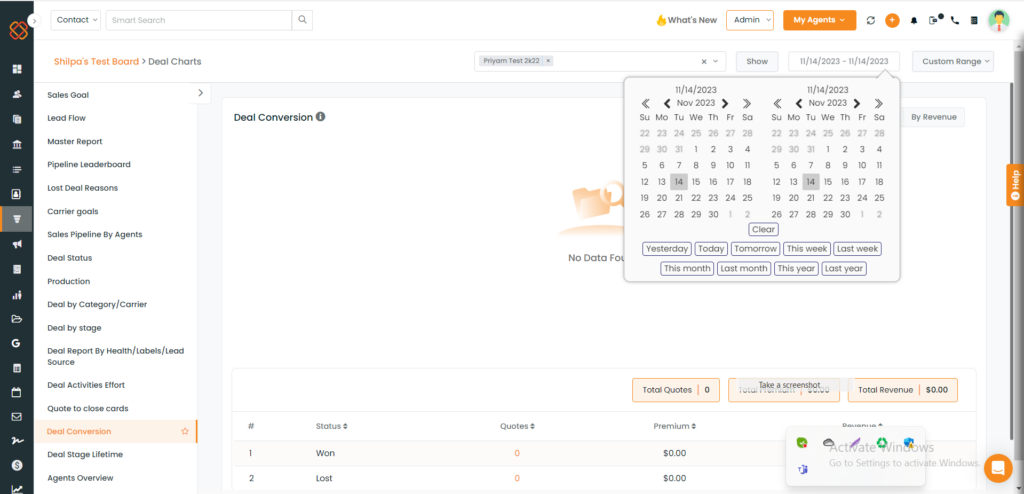
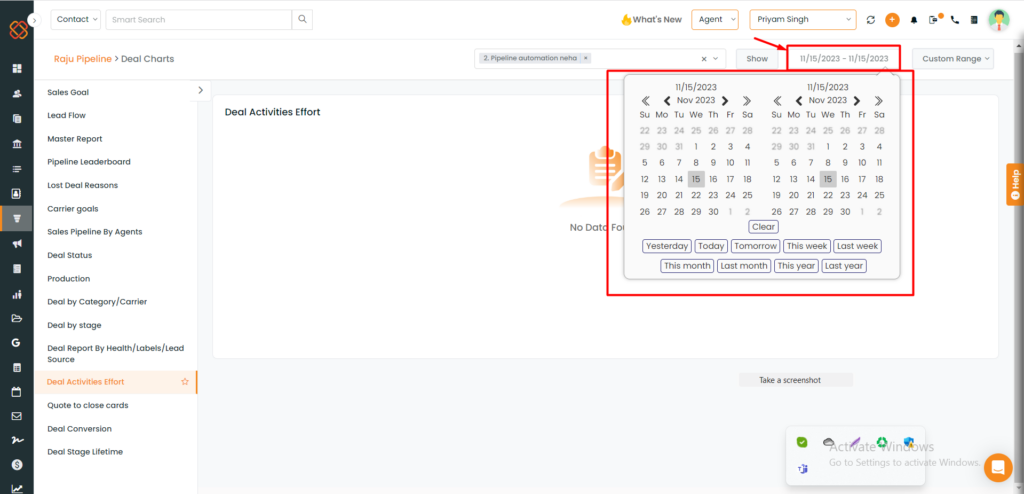
These charts can be filtered by date.
You can select dates of your choice to view the deal reports within that time frame.
Date Filters – Now you can customize the date range, today, yesterday, last 7 days, last 14 days, last 21 days, last 30 days, last 31 days, last month, this month, last week, this week, last year, and this year.
You can filter dates from anywhere in the Deal Charts
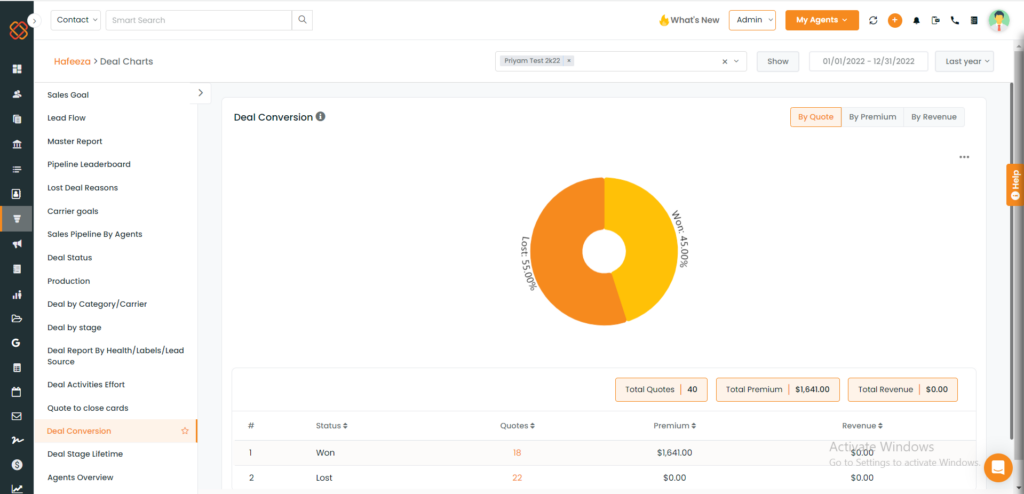
Deal conversion Won/Loss:
This is a simple bar graph chart that shows how many deals are converted to Won vs Lost in a specific time period (by default it is 30 days). Additional details about Won/Lost deals are available by clicking on the respective bars including Contacts, Deal value, Agent name, status and more.
Deal conversion by stages:
This is a stacked bar graph chart that shows the number of deals marked as Won/Lost by each stage you have defined in your deal stage. You get to learn at which stage most of your win is happening. Additional details about Won/Lost deals by stages are available by clicking on the stacked bar including Contacts, Deal value, status and more.
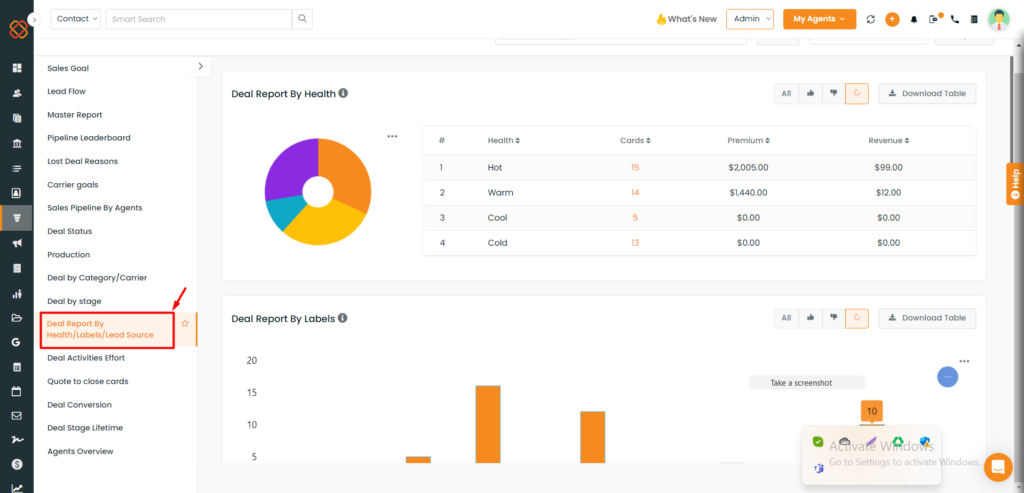
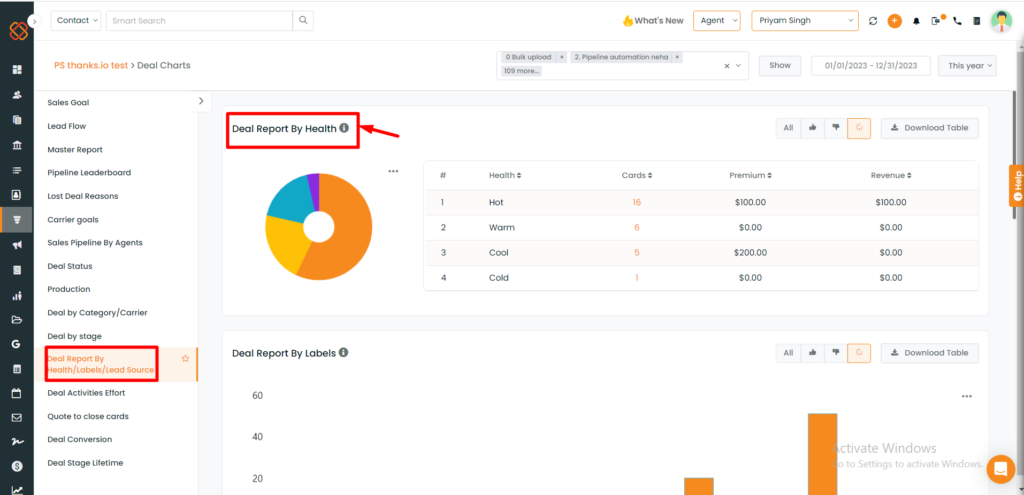
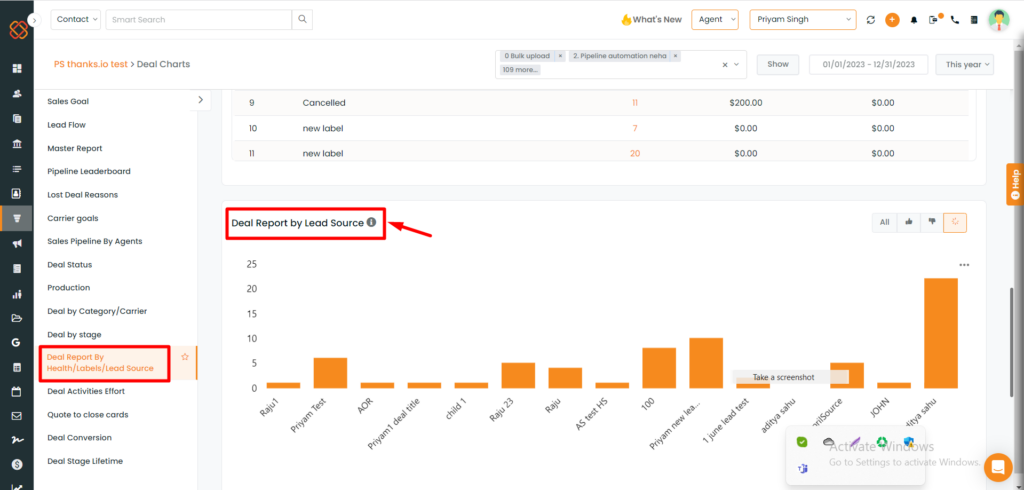
Deal Report by Health/Labels/Lead Source:
Note: According to our recent UI changes you can now view Deal reports by health/labels/lead source under one dashboard.
Check Deal Report by Health:
This is a simple pie chart that shows the status of the deals and can give you an idea of conversion chances.
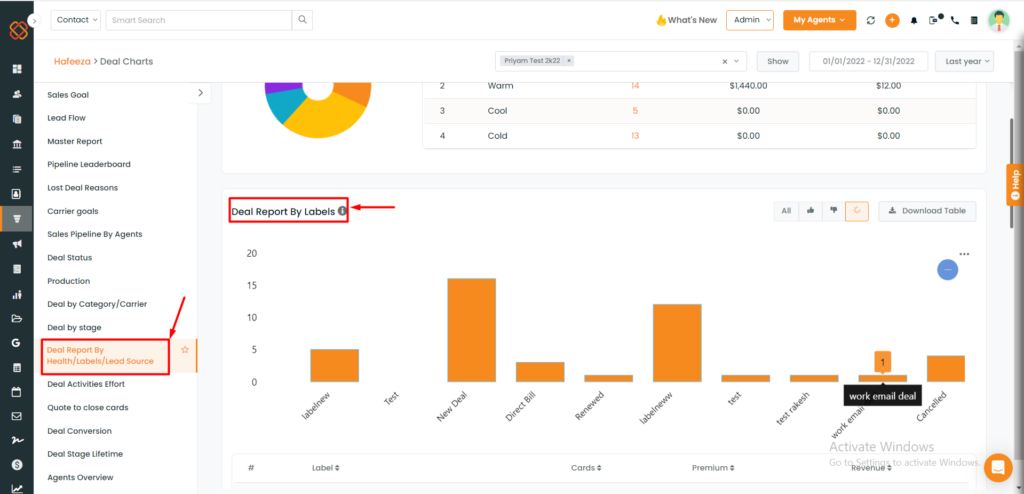
Segmenting deals by labels helps you understand the categories of deals that are coming through and their success rates. You can use labels as your source types.
Check Deal Report by Lead Source:
This segmentation will help you understand where you need to give special efforts to drive more leads.
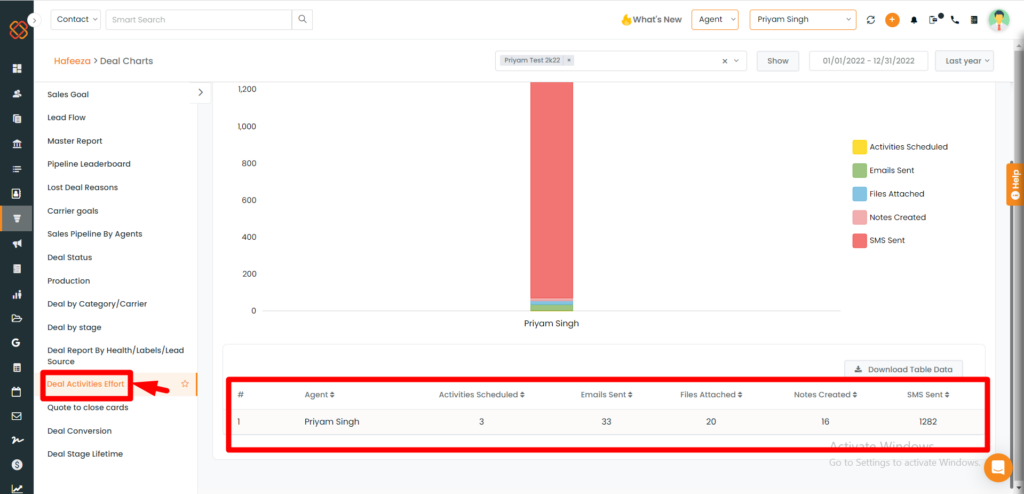
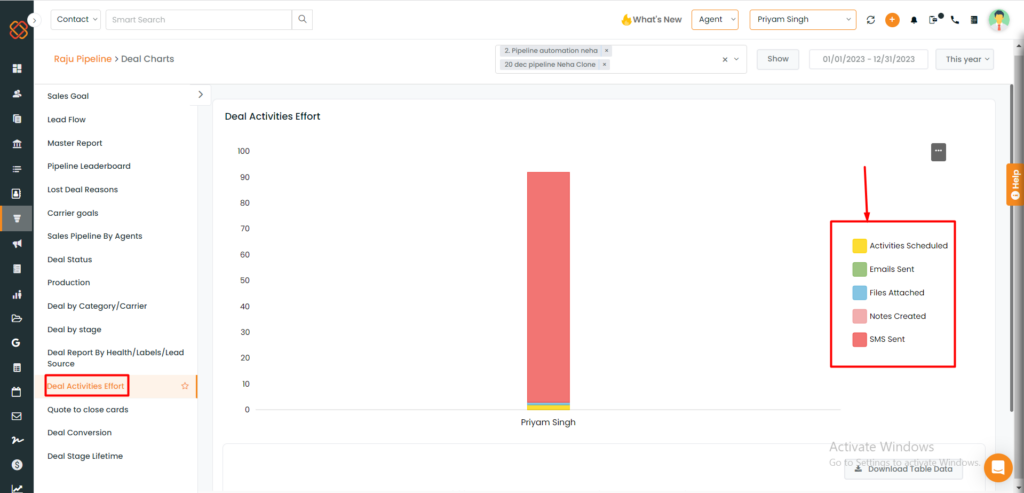
Deals Activities Effort:
Note: We have made some recent UI changes within the Deal Activities Effort.
This chart helps users understand your efforts on all the active deals in the deal board for that period. It will show the distribution of efforts pertaining to activities scheduled, email sent, files attached, notes created and SMS sent. Over a period of time and based on these activities, you will learn what the optimum activities count for you to have the best results.
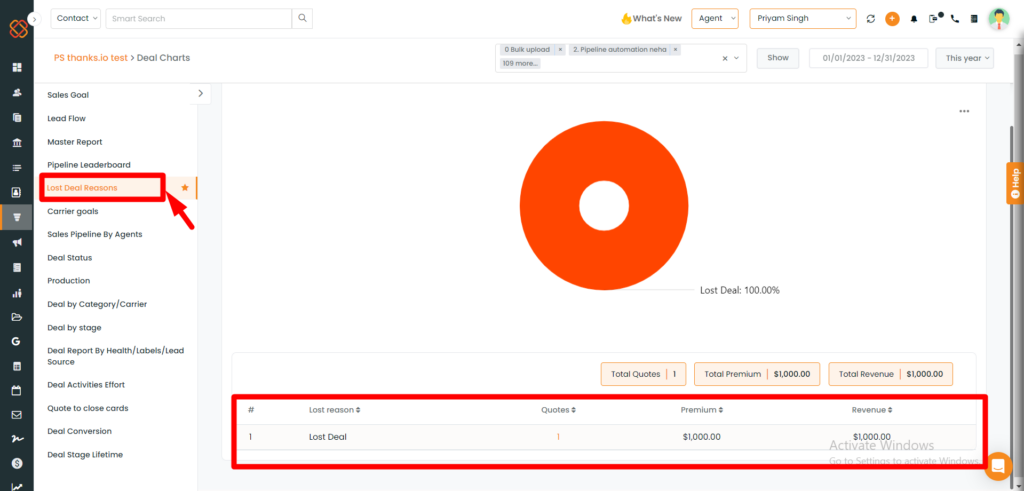
Lost Deal Reasons:
The segmentation done based on lost reasons, will help you to understand what is the common reason for not able to convert the lead. Based on that, you can make your team put special efforts to cover up that weak point, so that you can close the deal in future.
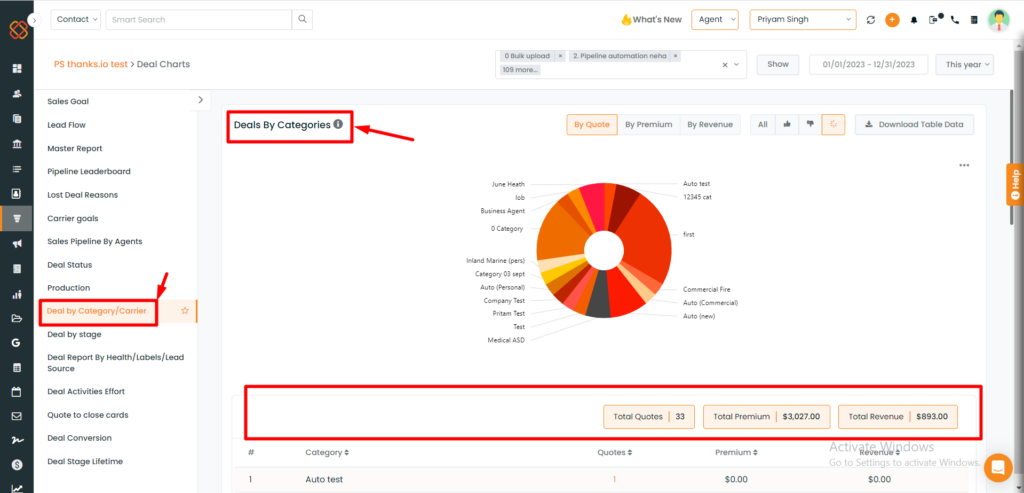
Deal by Categories/ Carrier:
Note: With our recent UI changes you can now view Deal by Categories/Carrier under one dashboard.
Deal by Categories:
Segmenting deals by categories helps you understand the categories of deals that are coming through and their success rates. You can use categories to drive major sales from those deals. You can also view the deal cards based on count or value. Just slide the toggle bar to select the preference.
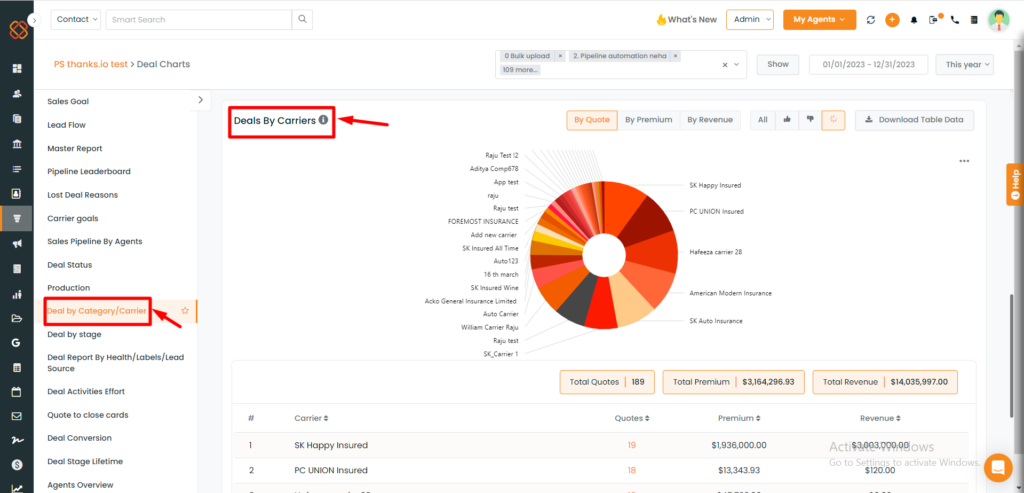
Deal by Carriers:
Deals by carrier pie-chart will represent all the deal cards available under each carrier. You can sort the pie chart based on the stage of the deal cards- All, Won, Lost, or in Process. You can also view the deal cards based on count or value by clicking the selected preference.
Note: “Deal by Carrier” report is available for both admin and agent.
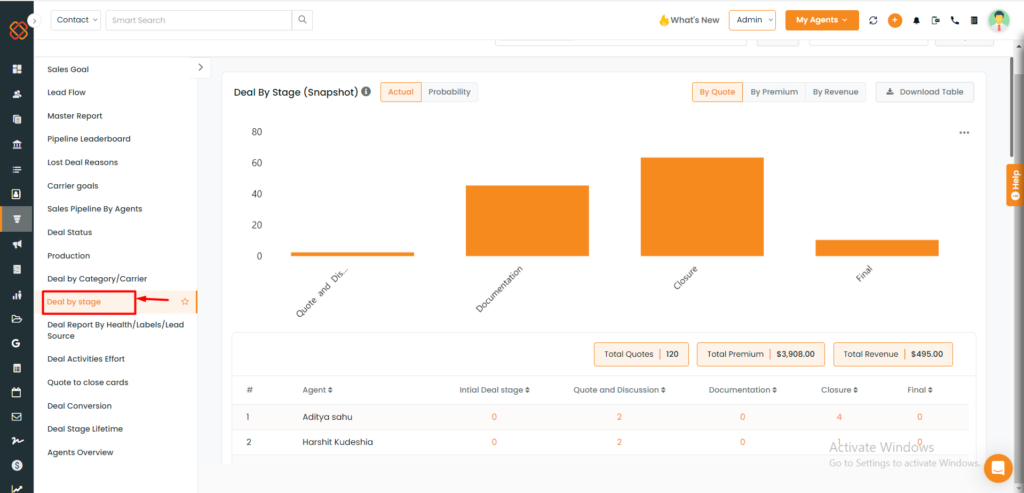
Deal by Stage
Note: According to our recent UI changes you can now view Deal by Stages/ Deal Conversion by Stage/ Deals Moved to Stages under one dashboard.
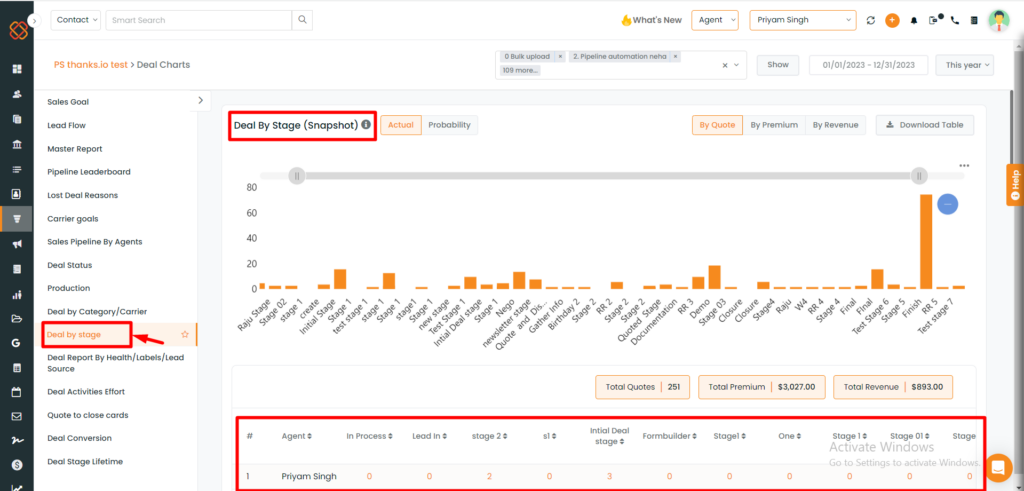
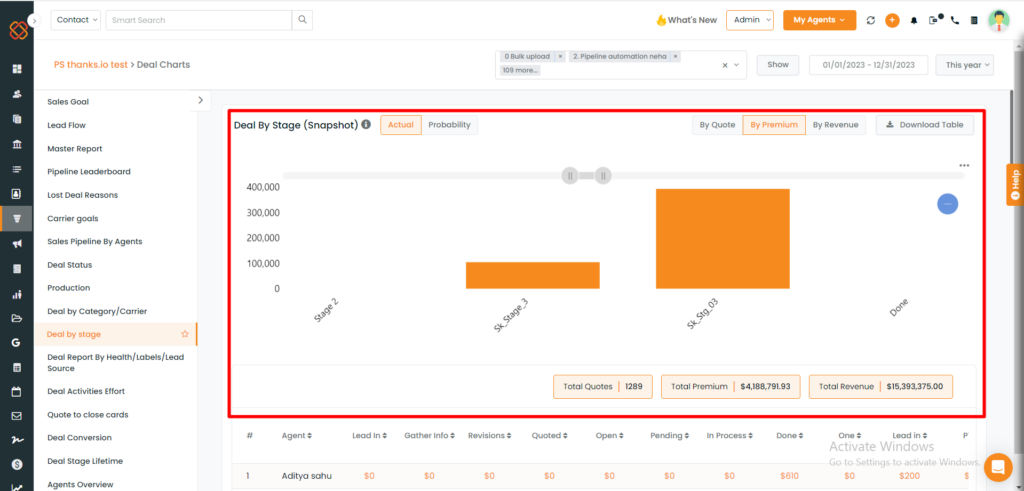
Deal By Stages- Snapshot:
Deal By Stages (Snapshot) chart will show you the number and value of deals that are currently in a particular stage within the set time frame that you will choose. These deal cards are based on the cards that are created in the current stage. You can view the deal details by count or by value.
To view this chart:
Navigate to Pipelines and click on the three-dots icon button.
Click on Deal charts.
Scroll down to view the Deals By Stages (Snapshot).
Select the date range.
Select count or value.
The chart will be represented.
Both graphical representation and table view are available.
Note: In the expanded view, you can have both a table and chart view of the deals in a particular stage
In the table, you can see the number of deal cards that are currently in each stage for each agent. If you click on the number of cards for each stage, it will take you to the deal card details of each stage.
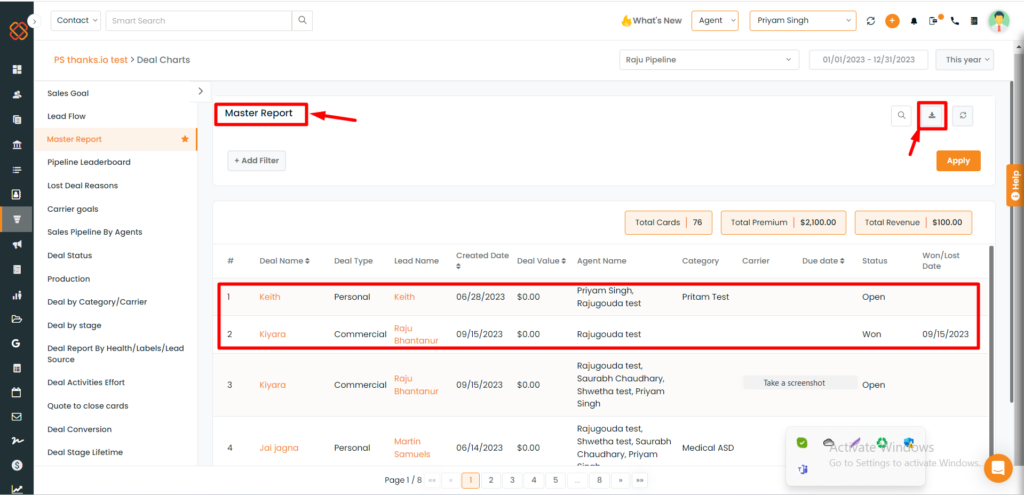
Master Report:
Now in the Master report option you can view the report based on Deals by stages (snapshot). You can select the pipeline for which you want to view the deal board.
If you click on any deal name it will take you to the deal card. And if you click on the lead name it will take you to the account360 section.
You can also download the deal card data/report by clicking on the download sign.
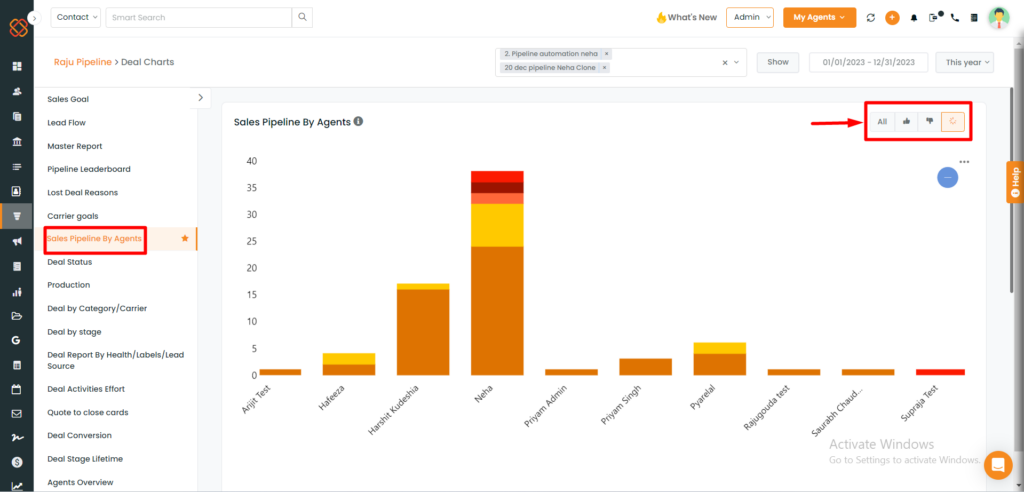
Sales Pipeline by Agents
This report is based on the agents so that you can analyze where and when they win. In this report you will get complete details of the deals that the agent is handling.
You can also view the details on the deals that are either won or lost or both by clicking on all.
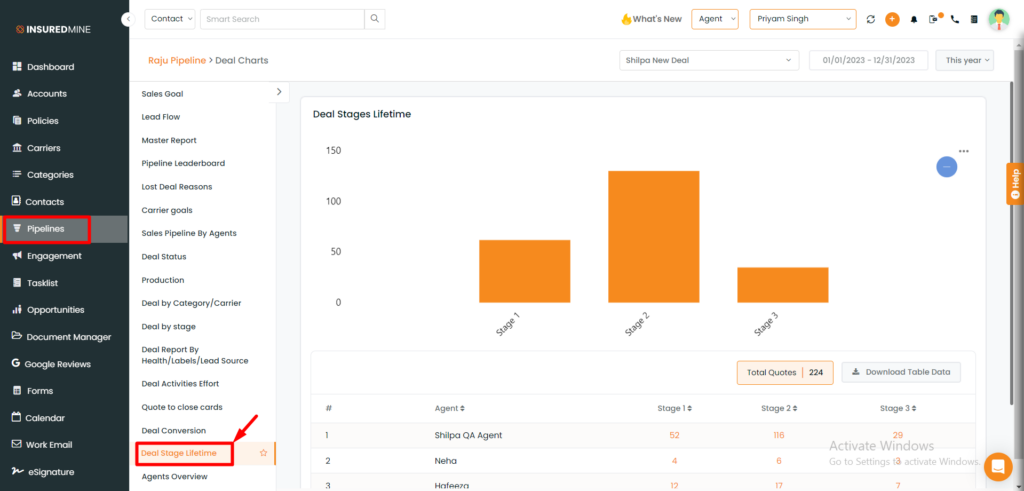
Deals Stages Lifetime
Deal Stages lifetime will help you to analyze the deal card in a specific timeline for each stage it has been through. You can have a view agent wise details of all its quotes at one shot, for all the stages where the card has been moved.
To view the enhancement:
Navigate to Pipelines and select Deal charts.
Click on Deal Stages Lifetime.
The report will show the total number of deals at different stages. You can also click to have a detailed table view of each stage.
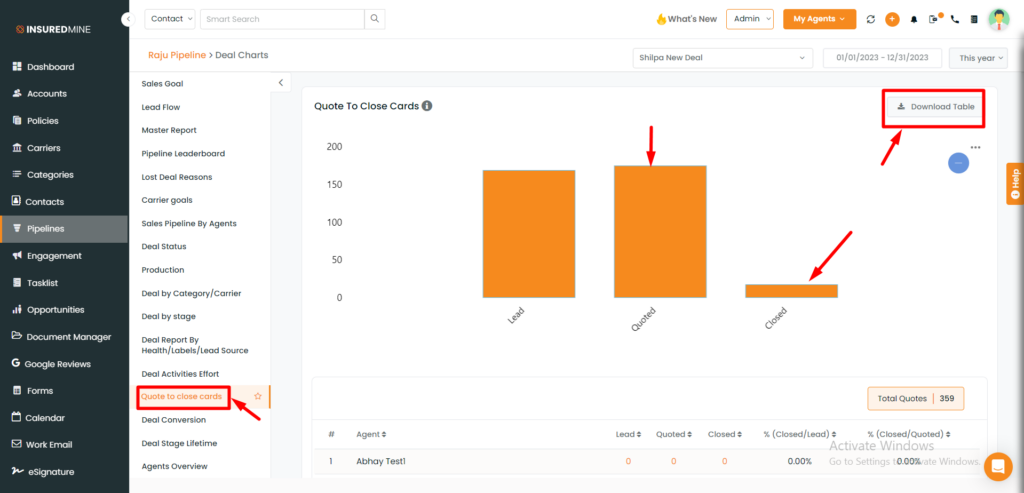
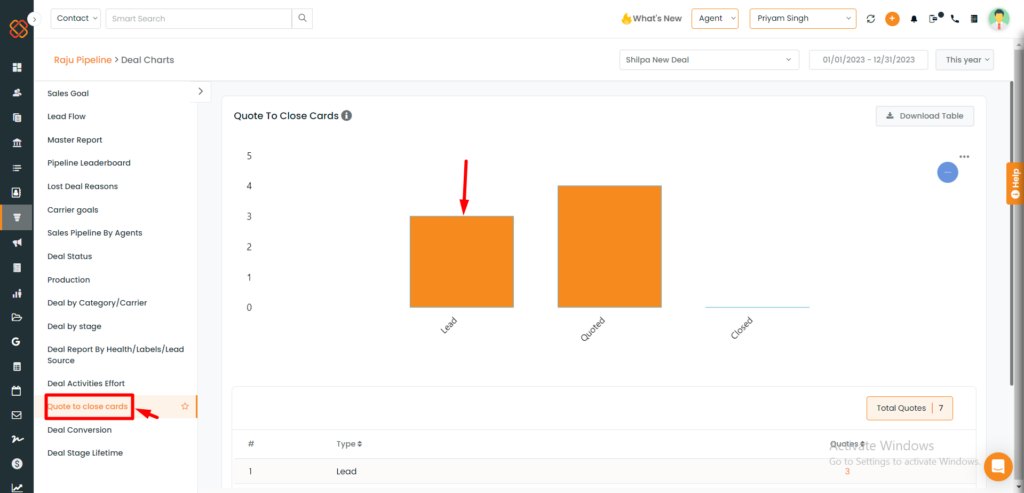
Quote to Close cards
In deal reports, you can find a new chart titled “Quote To Close Cards”. “Quote” refers to the total count of the quotes of the selected stage. This number includes quotes that are in process, lost or won. “Closed” is the total count of deal cards won in the selected pipeline. The purpose of this enhancement is to show the ratio between quoted and closed deal cards.
Note: Agents can add a stage from the chart itself (if one does not exist) and can be updated in the pipeline settings.
To view ‘Quote to Close cards’ chart:
Navigate to Pipeline.
Click on the action button (3 dots).
Select deal charts.
Scroll down to view Quote to Close Cards.
Select the date range for which you want to see the ratio between quoted and closed cards.
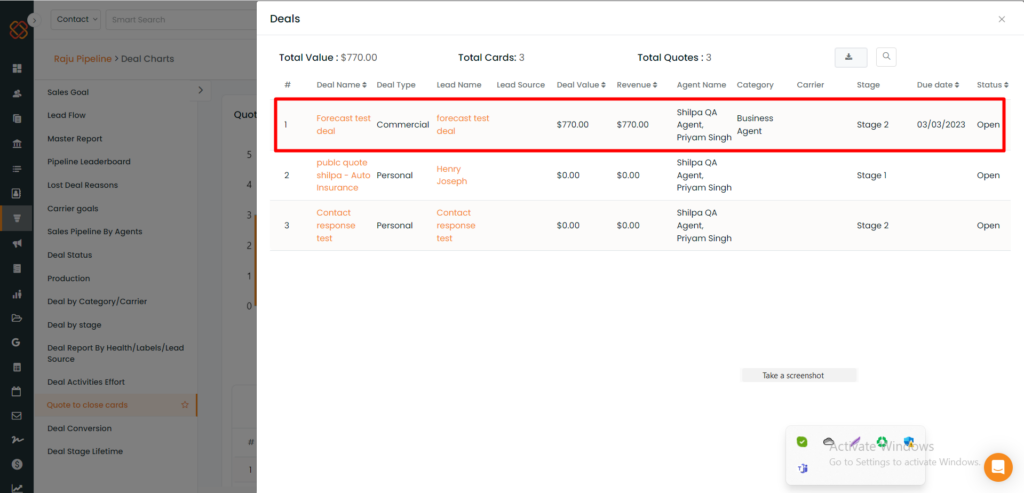
Click on the quoted or closed bar to view the list of deal cards.
Click the download icon to download the report.
The list will include: total value, total number of cards, each card detail-Deal Name, Lead Name, Lead Source,Deal Value, Expected Revenue, Agent Name, Category, Carrier, Stage, Status, Won/Lost Date.
Click on the deal name to view the deal card.
To view the contact in Account 360 click the lead name.
Note: Quote will include all the deal cards that are in process, lost or won of the selected stage in Pipeline.
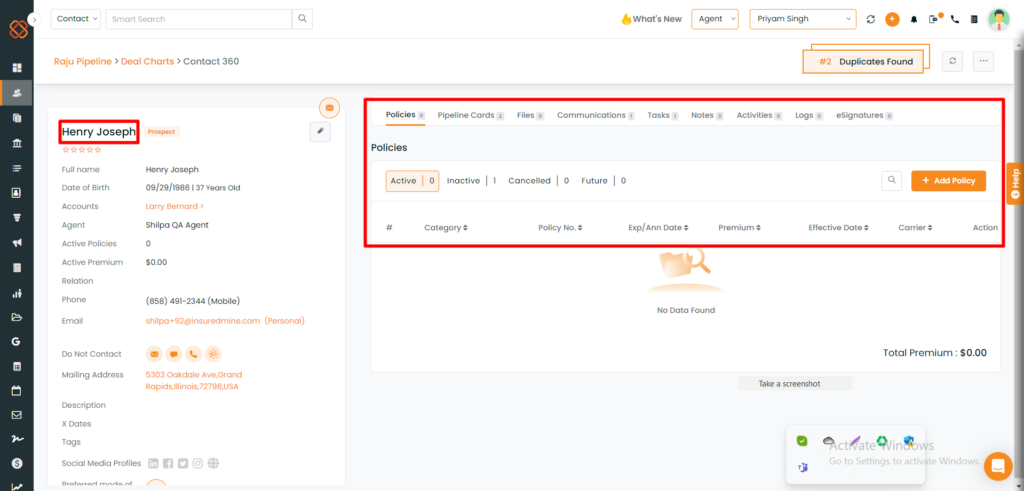
Lead to Quote to Close Chart in Pipelines
In the Quote to Close chart you will be able to view how many leads you created vs how many you quoted vs how many you have closed.
A short window will appear from the right where If you click on the lead name, for a commercial account, Account 360 will open if it is a personal account Contact360 will open.
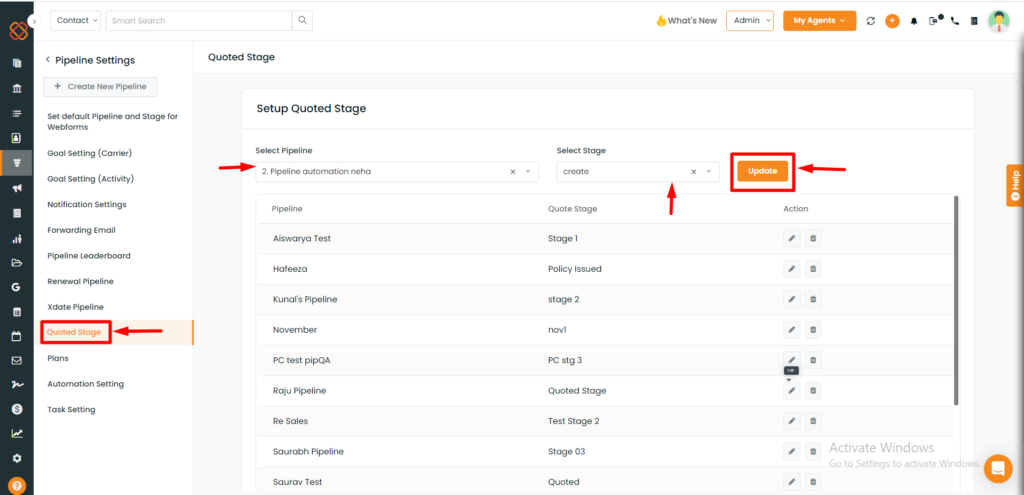
How to update the ‘Setup Quoted Stage’?
Note: Only admin can access the ‘Setup Quoted Stage’.
Click on the action button(3 dot icon) and click on settings.
Click on Setup Quoted Stage.
To set up the Quote to Close stage, select the pipeline and the stage from the dropdown.
Click on update.
Deal Activities Effort:
In the Deal Activity Effort feature, admins can now have the capability to access a visually informative stacked bar chart showcasing the activities of agents under their supervision. This graphical chart view offers a comprehensive overview of agent performance and engagement in deal-related tasks.
To view the enhancement:
Navigate to Pipelines
Click on 3 dots and select Deal Charts
Select Deal Activities Effort
Agents will be able to view the report based on all the activities they have performed.
For Admin or Manager, he/she will be able to view deal charts on all the activities performed by their agents.
You can also sort the data by date
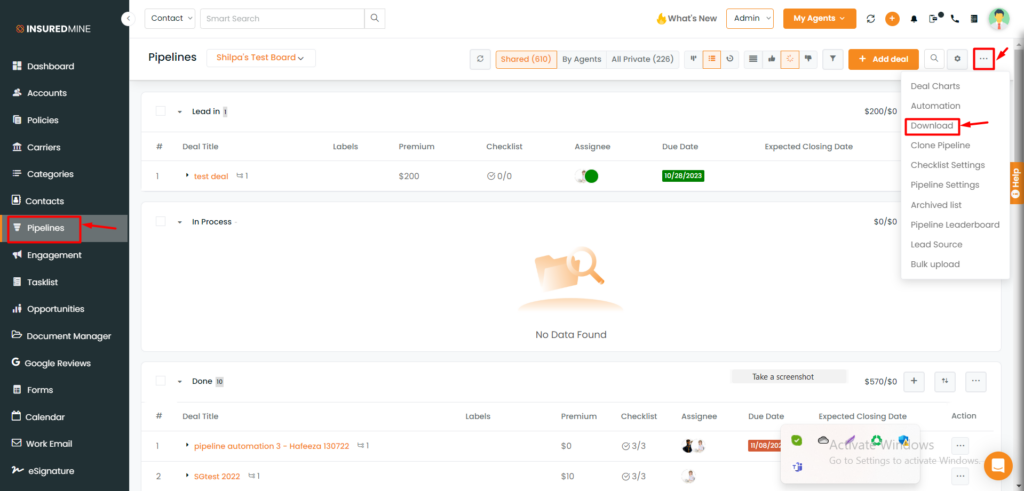
Download Pipeline Cards with Stages Analytics
When you download deal cards from a pipeline, you will have details of how many days the card stayed in each stage.
Note: You can download deal cards of a particular pipeline, a particular stage, or even download any particular deal card. In each case, the stage data will be different.
For a single deal card or for all the deal cards of a selected pipeline the data of each stage will be provided. But in case if you are downloading a deal card of any particular stage, then the data you will receive will be of that particular stage.
To check the enhancement:
Navigate to Pipelines.
Select the Pipeline for which you want to download the deal card data.
Click on download.
Open the CSV file that will get downloaded.
Scroll it to view the stages of data analytics.
Note: If a deal card has reached a particular stage and moved from that stage to another in the same day, it will show 0 days for that stage.
Note: The download option is available in card view and list view.
You can also view the report of a particular pipeline, by clicking on the report icon beside the pipeline.
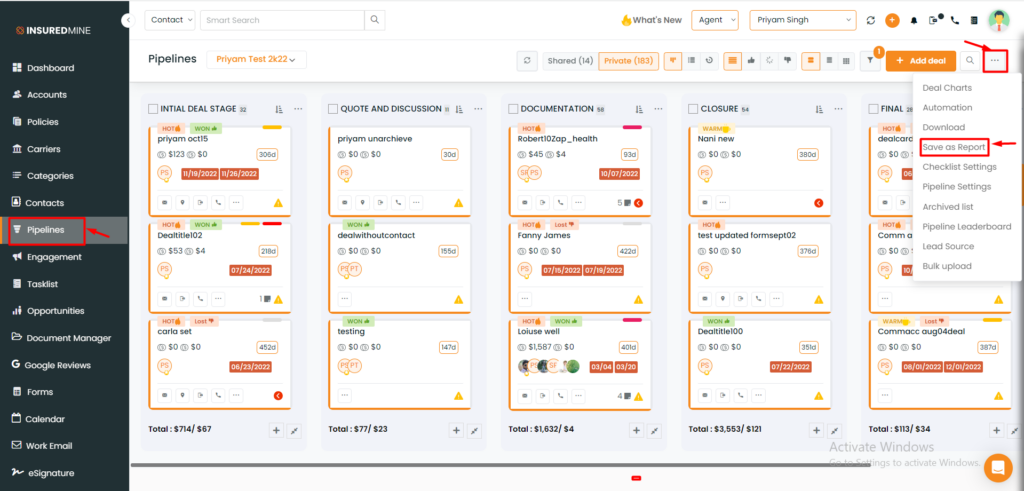
Save as Report
You can now save the complete deal status of the pipeline by clicking on save as report.
Navigate to Pipelines.
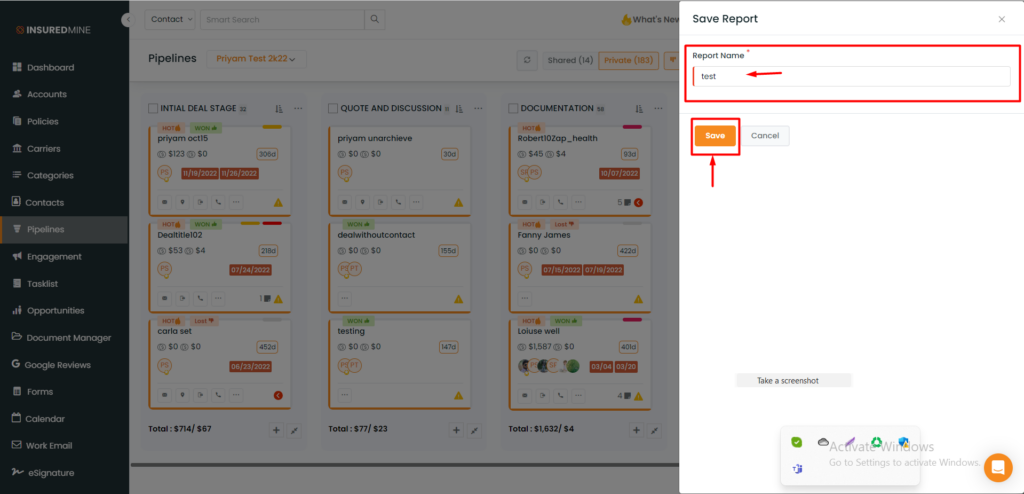
Click on the 3 dots and then from the drop down click on Save as Report.
A window from right will open, where you need to give a report name.
Click on save.
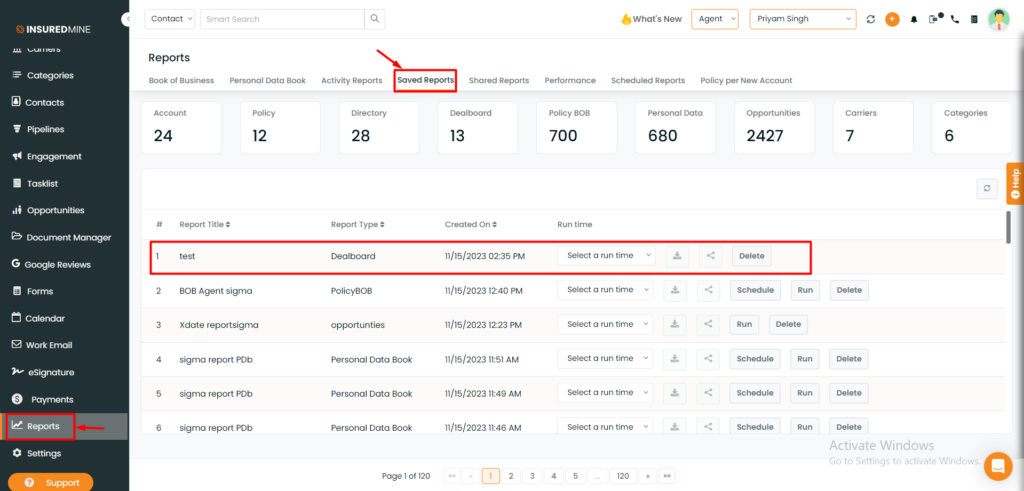
You can view the reports in the report section. ( Navigate to report> Click on Saved Reports>Scroll to select and view your saved report by report name).
Note: You can change Pipeline while being in the charts section to see the analytics of another pipelines.