


Overview
The Sales Goal dashboard previously allowed users to select and view sales goals for only one pipeline at a time.
When an agent was part of multiple pipelines, users could not view the agent’s combined sales goal across all assigned pipelines.
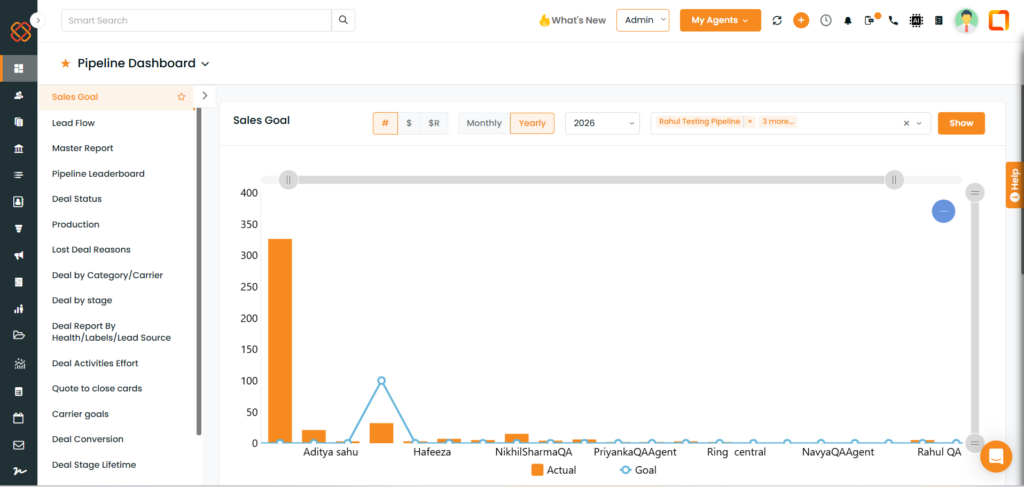
To address this limitation, the Sales Goal dashboard has been enhanced to allow users to select multiple pipelines and view the agent’s combined sales goal and actual performance across the selected pipelines.
Enhancement
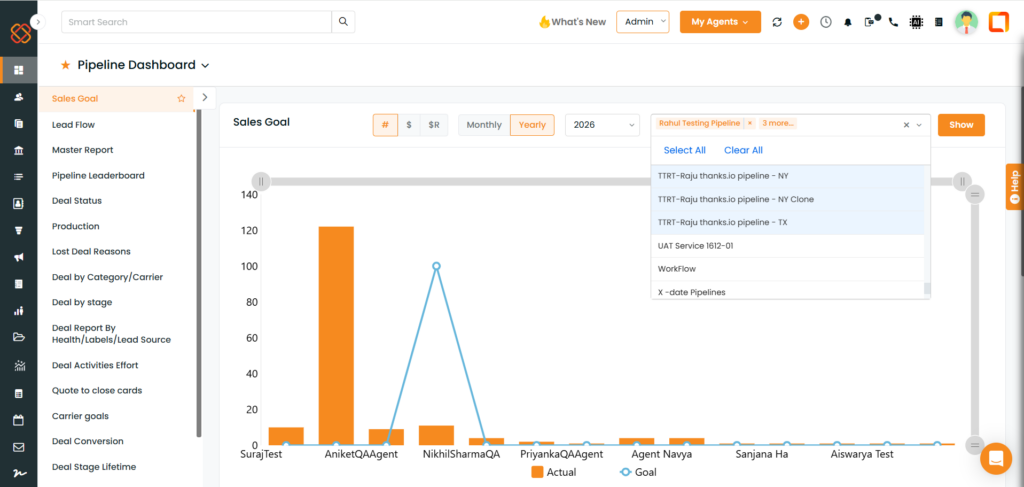
Users can now select multiple pipelines from the pipeline filter in the Sales Goal dashboard.
When multiple pipelines are selected:
- The selected pipelines are displayed in the pipeline filter.
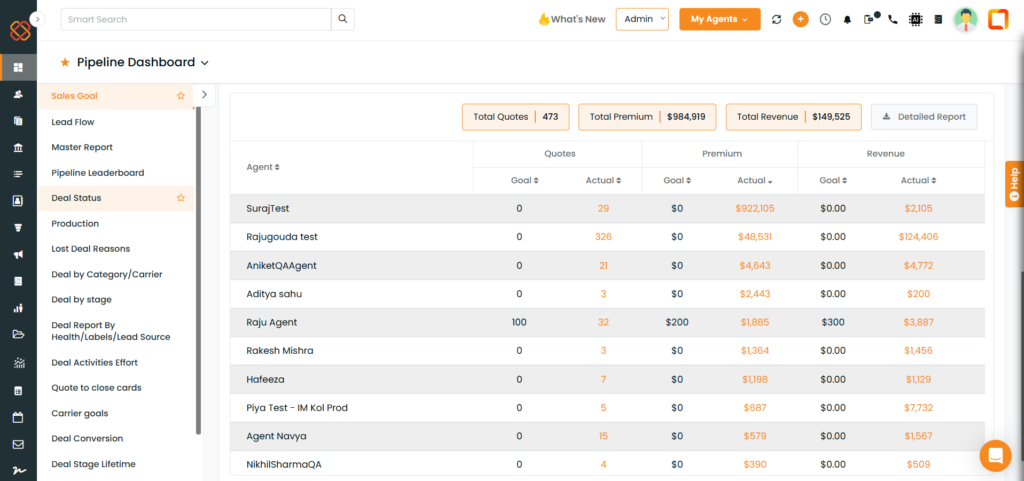
- The Sales Goal for an agent is combined across all selected pipelines.
- The agent’s Goal and Actual values are calculated based on the selected pipelines.
- Users can view the combined sales performance without checking each pipeline separately.
How It Works
- Navigate to Dashboard → Sales Goal.
- Select the required time period, such as Monthly or Yearly.
- Select the required month/year.
- Click the Pipeline dropdown.
- Select one or more pipelines.
- Click Show to view the results.
- The Sales Goal dashboard will display the agent’s combined goal and actual values for all selected pipelines.
Example
Suppose an agent is assigned to:
- Test – 1
- Test – 2
Previously, the user had to select each pipeline separately to view the agent’s sales goal.
With the new enhancement, both pipelines can be selected together. The Sales Goal dashboard will then display the agent’s combined goal and actual values from both pipelines.
Benefit
This enhancement provides a consolidated view of an agent’s sales performance when the agent is assigned to multiple pipelines, eliminating the need to check each pipeline individually.


