InsuredMine CRM | Optimize and Grow Your Insurance Agency

Agency Portal Overview

Agency Portal is created for the agent so he can have an overview of all his existing clients in a single dashboard. Most of the information in the Agency Portal is pulled from the Agency Management System (AMS) that the agent uses including his Customers, Premiums, Carriers, etc. Agency Portal has built in APIs, to fetch data to our Agency Portal. You do not have to manually update the data in the Agency Portal. There are several components to the Agency Portal dashboard that are explained below in detail.

Dashboard – Our dashboard provides an overall view of all our KPIs (Key Performance Indicators) pertaining to the agent’s book of business. Components within the dashboard can be viewed and accessed with a hover of the mouse or by clicking the actionable items (indicated in orange). Some actionable items on the dashboard include:

1. Widgets: Widgets are developed to help agencies know metrics and provide easily actionable intelligence about the business. They can be sorted and filtered based on the business needs of the agents. They can also be customized as needed. Shown below are four examples of widgets filtered by:

  • Customers by Age – View your customers filtered by their age ranges. This histogram chart provides you the age distribution of your current contact database.
  • Policies by Expiration Dates – You can view a snapshot of all policies set to expire in a particular month. When you select a particular month, underneath the chart, you can see the Total Policies with a number beneath it. That orange number is an actionable item, which when you click will give the details of all your customers with policies set to expire in that month. You can select all these customers and send a mall email to remind them. We will cover the topic of mass email in the section ‘Email Campaign’.
  • Policies by Line of Business – With this donut chart widget, you can visualize your book of business by line to understand what percentage of total business does a particular line represent.
  • Contacts – View your customers sorted either by their First or Last Names. Access all names and be able to communicate with your contacts with a single click.
  • Client location on Google Map – Map widget helps you identify client clusters in seconds and keep your agency well represented geographically to maintain better loss ratios.

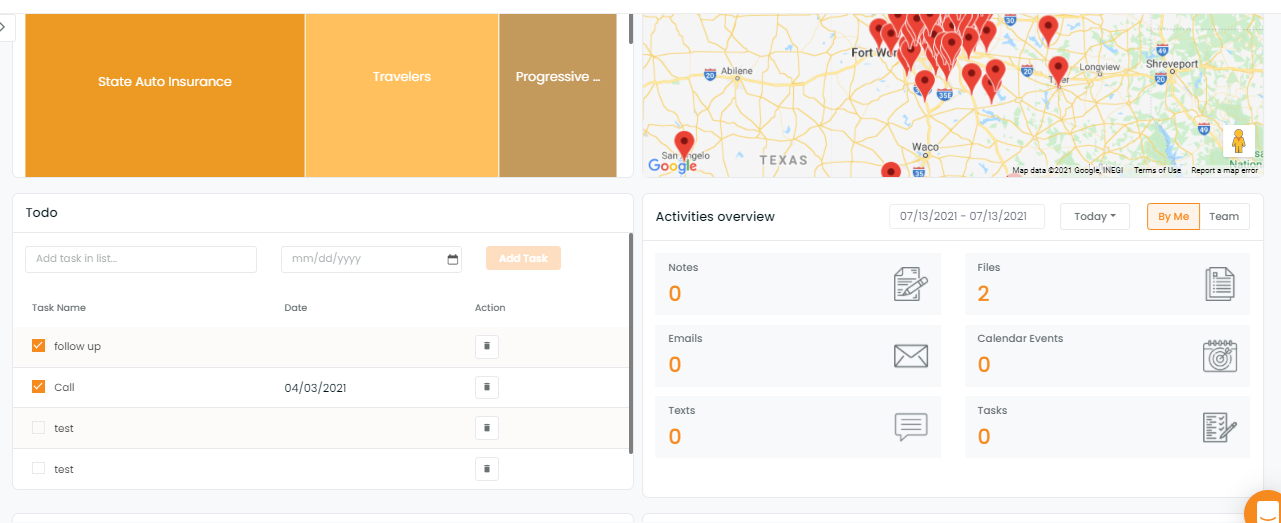
2. Key Metrics boxes: Provides an overall view of the metrics of your business including Clients, Premium, Policies, and Carriers. A limited number of items makes you focus on them. All of them except premium are clickable. By clicking on these KPI, you can access list of all clients, all policies or all carriers.

3. Chats: Chats provide a history of all the chat conversations that you had with any customer.
4. Left Navigation: Left Navigation panel has all the key features that can be accessed through the click of the mouse.

5. Messages: Messages contain any messages that you may have received from your customers.

6. Notifications: Any reminders that you have set for yourself will show up as notifications.

7. Task List: An overview of all the tasks that you are due to complete and also a list of completed tasks. You can also add/create tasks directly to the list.

Related Articles

Would you recommend this article?

Related Categories

Contact Us

Looking for more information or want to try one of our paid plans?

EMAIL

PHONE

OUR LOCATION

Search
Generic filters

Most Search: Ams360Release Notes